
Soybeans Swing Point And Targets.
Soybeans
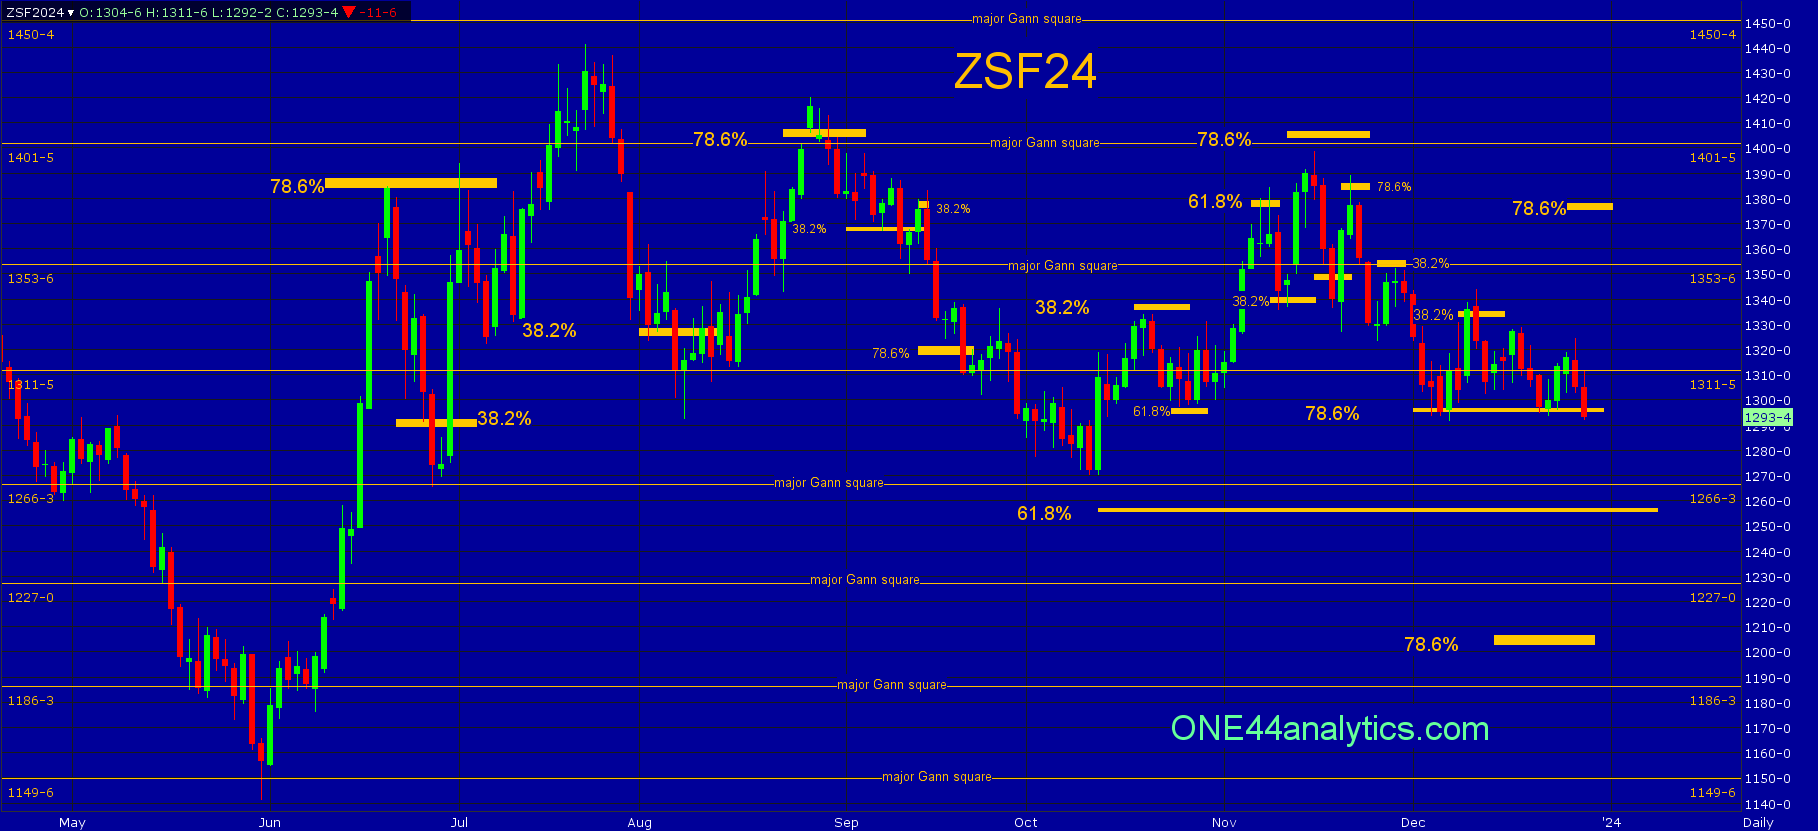
The chart is key to this analysis!
This will be the last update for January.
From last week,
It was a quiet week for Soybeans, the rally from 78.6% at 1297.50 could only get to 38.2% back up at 1333.00 and is now back down to the swing point for the week at 1297.50.
Use 1297.50 as the swing point for the week again.
This week was another quiet one and it held the 1297.50 swing point for the week.
Use 1297.50 as the swing point again.
As far as the seasonal timing it has been in a downward trend since the 11/15/23 high so it wont end up being a high, but it looks like it will stand out as a bottom provided the swing point holds. This looks the same for all the Grains.
Above it, being a 78.6% retracement we will be looking for 78.6% the other way following the ONE44 78.6% rule at 1375.00. The short term target is the 1353.75 major Gann square.
Below it, look for the area of the 1266.25 major Gann square and 61.8% of the 5/31/23 low and 7/24/23 high at 1258.00. On an extended move lower, look for 78.6% of the same move at 1206.00.
We recently did a post on the Soybean ETF SOYB, you can find it here.
VIDEO
(ZSF24) (SOYB) (CLG24) (LEG24) (ADM)
Our latest Fibonacci retracement Video with the ONE44 rules and guidelines shows what to look for when targets are not met. We cover Soybeans, Crude Oil, Lean Hogs and the stock ADM
ONE44 Analytics where the analysis is concise and to the point
Our goal is to not only give you actionable information, but to help you understand why we think this is happening based on pure price analysis with Fibonacci retracements, that we believe are the underlying structure of all markets and Gann squares.
If you like this type of analysis and trade the Grain/Livestock futures you can become a Premium Member.
You can also follow us on YouTube for more examples of how to use the Fibonacci retracements with the ONE44 rules and guidelines.
Sign up for our Free newsletter here.
FULL RISK DISCLOSURE: Futures trading contains substantial risk and is not for every investor. An investor could potentially lose all or more than the initial investment. Commission Rule 4.41(b)(1)(I) hypothetical or simulated performance results have certain inherent limitations. Unlike an actual performance record, simulated results do not represent actual trading. Also, since the trades have not actually been executed, the results may have under- or over-compensated for the impact, if any, of certain market factors, such as lack of liquidity. Simulated trading programs in general are also subject to the fact that they are designed with the benefit of hindsight. No representation is being made that any account will or is likely to achieve profits or losses similar to those shown. Past performance is not necessarily indicative of future results.
On the date of publication, Nick Ehrenberg did not have (either directly or indirectly) positions in any of the securities mentioned in this article. All information and data in this article is solely for informational purposes. For more information please view the Barchart Disclosure Policy here.