Grain Markets Test Significant Resistance. Can the Rally Continue?
A bullish surprise in US production numbers from Friday’s USDA report has reignited the optimism for higher prices. How much more upside is left?
Corn
Technicals
Follow-through to start the week gave corn Bulls a little extra peace of mind, closing at the highest price levels since last June. The market fell just shy of our next resistance pocket, which remains intact for today’s trade from 479 3/4-480 1/2. Previous resistance at 470-471 1/2 is now support. Below that and a retracement of Friday’s move higher could be in the cards. Momentum remains strong and we wouldn’t be surprised to see the Funds cointnue to press the market higher with the mentaility that it is a Bullish environment until proven otherwise.
Technical Levels of Importance
Resistance: 479 3/4-480 1/2, 487-488*
Pivot: 470-471 1/2
Support:459-460, 449 3/4 – 452 1/4
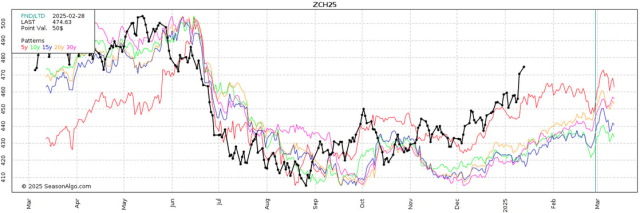
Seasonal Tendencies Update
(Updated on 1.13.25)
Below is a look at historical price averages for March corn futures on a 5, 10, 15, 20, and 30 year time frames (Past performance is not necessarily indicative of future results).
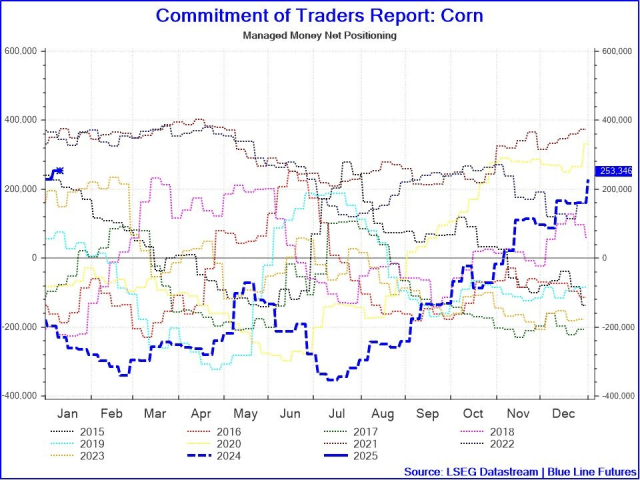
Commitment of Traders Update
(Updated on 1.14.25)
Managed Money increased their net long position to 253,346 futures and options contracts, the largest net long since November of 2022.
Soybeans
Technicals
4-star resistance and the upside target of 1055-1062 1/2 was achieved in the overnight session, posting a high of 1056 3/4 (the highest price since October). If you have been long the market this may be a place to consider reducing exposure or hedging exposure. We remain optimistic but want to be sure to protect price here. If the market continues to stall here a retracement of yesterday’s run higher wouldn’t be out of the question and could lead to a retest of 1021 3/4-1028. If the Bulls can keep the momentum going, a run towards $11 is not out of the question. This level is both technically and psychologically significant and may not be as far stretched as you think.
Technical Levels of Importance
Resistance: 1055-1062 1/2, 1097 1/4-1101
Pivot: 1021 3/4-1028
Support: 1003-1008 1/4, 982-985, 963 1/4, 940–945 1/4
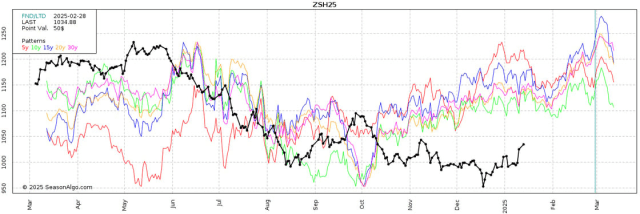
Seasonal Tendencies Update
(Updated on 1.13.25)
Below is a look at historical price averages for January soybean futures on a 5, 10, 15, 20, and 30 year time frames (Past performance is not necessarily indicative of future results).
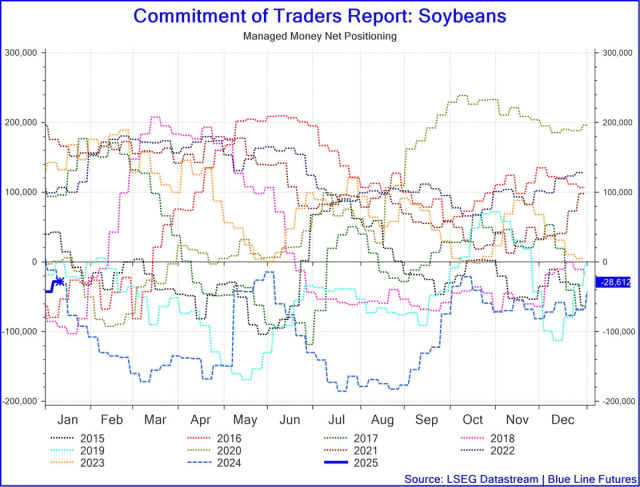
Commitment of Traders Update
(Updated on 1.14.25 )
Managed Money reduced their net short position to just 28,612 contracts. Keep in mind that this data doesn’t include Friday’s or Monday’s trade, they are likely back to net long for the first time since December 26th 2023.
Ready to dig in?
Subscribe to our daily Grain Express for fresh insights into Soybeans, Wheat, and Corn. Get our expert technical analysis, proprietary trading levels, and actionable market bias delivered right to your inbox.
Sign Up for Free Futures Market Research – Blue Line Futures
Futures trading involves substantial risk of loss and may not be suitable for all investors. Therefore, carefully consider whether such trading is suitable for you in light of your financial condition. Trading advice is based on information taken from trade and statistical services and other sources Blue Line Futures, LLC believes are reliable. We do not guarantee that such information is accurate or complete and it should not be relied upon as such. Trading advice reflects our good faith judgment at a specific time and is subject to change without notice. There is no guarantee that the advice we give will result in profitable trades. All trading decisions will be made by the account holder. Past performance is not necessarily indicative of future results.
Blue Line Futures is a member of NFA and is subject to NFA’s regulatory oversight and examinations. However, you should be aware that the NFA does not have regulatory oversight authority over underlying or spot virtual currency products or transactions or virtual currency exchanges, custodians or markets. Therefore, carefully consider whether such trading is suitable for you considering your financial condition.
With Cyber-attacks on the rise, attacking firms in the healthcare, financial, energy and other state and global sectors, Blue Line Futures wants you to be safe! Blue Line Futures will never contact you via a third party application. Blue Line Futures employees use only firm authorized email addresses and phone numbers. If you are contacted by any person and want to confirm identity please reach out to us at info@bluelinefutures.com or call us at 312- 278-0500
Performance Disclaimer
Hypothetical performance results have many inherent limitations, some of which are described below. No representation is being made that any account will or is likely to achieve profits or losses similar to those shown. In fact, there are frequently sharp differences between hypothetical performance results and the actual results subsequently achieved by any particular trading program.
One of the limitations of hypothetical performance results is that they are generally prepared with the benefit of hindsight. In addition, hypothetical trading does not involve financial risk, and no hypothetical trading record can completely account for the impact of financial risk in actual trading. For example, the ability to withstand losses or to adhere to a particular trading program in spite of trading losses are material points which can also adversely affect actual trading results. There are numerous other factors related to the markets in general or to the implementation of any specific trading program which cannot be fully accounted for in the preparation of hypothetical performance results and all of which can adversely affect actual trading results.